


Ruslan Bayov1, Gurbandurdy Arbadov1, Muhammad Nour1, Mohamed Anwar1, Abdulaziz Alajami1, Eisa Al Shamisi1, Alexey Ruzhnikov2, Nurpeis Akhmetov1, Ahmed Abdelaziz1, Mohamed Reda1
1. ADNOC Onshore, 2. Turnwell.
Copyright 2026, Unconventional Resources Technology Conference (URTeC) DOI 10.15530/urtec-2026-4494172
This paper was prepared for presentation at the Unconventional Resources Technology Conference held in Houston, Texas, USA, 22-24 June 2026.
The URTeC Technical Program Committee accepted this presentation on the basis of information contained in an abstract submitted by the author(s). The contents of this paper have not been reviewed by URTeC and URTeC does not warrant the accuracy, reliability, or timeliness of any information herein. All information is the responsibility of and is subject to corrections by the author(s). Any person or entity that relies on any information obtained from this paper does so at their own risk. The information herein does not necessarily reflect any position of URTeC. Any reproduction, distribution, or storage of any part of this paper by anyone other than the author without the written consent of URTeC is prohibited.
Abstract
This paper presents a step-change transformation in drilling performance within Company’s unconventional development program, where overall drilling efficiency was effectively tripled through a structured optimization approach. In this context, drilling efficiency is defined as delivered footage per rig day, achieved through the combined effect of increased section-average rate of penetration (ROP) and significant reduction in repetitive flat time, rather than a proportional increase in instantaneous on-bottom ROP.
The transformation was driven by a fully integrated, multidisciplinary workflow combining drilling engineering, geosteering, downhole technologies, and rig-site execution. The approach included systematic redesign of bottomhole assemblies (BHAs), deployment of fit-for-purpose drill bits and rotary steerable systems, application of shock and vibration mitigation tools, optimization of drilling parameters, and continuous real-time performance tracking. Execution was governed by a structured test–learn–standardize cycle, enabling rapid scaling of successful practices across rigs and pads.
The campaign delivered substantial and repeatable performance improvements across all hole sections, with ROP increases of 202% in the 17½-in. section, 153% in the 12¼-in. section, and 162% in the 8½-in. curve and lateral. Weight-to-weight (W2W) connection times were reduced by more than 80%, significantly improving time-based efficiency and operational consistency. At the campaign scale, more than one million feet were drilled and over 140 wells were completed within one year. Average well delivery time was reduced from approximately 46 days to a minimum of 13.5 days (spud-to-rig release), representing the fastest documented unconventional oil well delivery within the Company’s approved drilling program.
In addition to operational performance gains, the reduction in drilling time translated into measurable environmental benefits through decreased fuel consumption and associated CO₂ emissions per well. The results demonstrate that a disciplined integration of technology, execution practices, and real-time performance management can deliver scalable and repeatable efficiency gains in complex unconventional carbonate reservoirs.
The study provides a practical optimization framework applicable to high-volume unconventional developments, highlighting the critical role of execution discipline, rapid learning cycles, and cross-functional integration in achieving sustained, industry-leading drilling performance.
Introduction
The United Arab Emirates contains one of the most significant unconventional hydrocarbon accumulations in the Middle East. Publicly available assessments report approximately 160 Tcf of technically recoverable unconventional gas (ADNOC, 2026). Other independent evaluations estimate roughly 220 billion barrels of tight oil and approximately 160 Tcf of gas in place (Caines, 2024), with technically recoverable volumes on the order of 25 billion barrels of oil and nearly 230 Tcf of gas (Dou et al., 2024).
Despite methodological differences between studies, all published estimates converge on a resource base exceeding 160 Tcf of gas and 25 billion barrels of oil in place.
The majority of unconventional prospects are situated in the southwestern part of the country. Key oil-focused developments are associated with the Operator Field #1, Operator Field #2, and Operator Field #3 areas, while major unconventional gas initiatives are concentrated near Gas Field. In total, more than 45,000 km² of territory is considered prospective for unconventional oil and gas systems.
Systematic field appraisal activities commenced in the early 2020s, with pilot wells initiated around 2022 and broader development accelerating from 2024 onward. More than 140 wells have been drilled and completed to date; however, this still represents an early-stage relative to the overall areal extent and resource scale of the play. Current efforts emphasize delineation, drilling optimization, completion refinement, and progressive industrialization of the development model.
Within the unconventional oil portfolio, production targets are primarily associated with the UC Oil Reservoir Formation, a Cenomanian organic-rich carbonate source interval that represents one of the largest unconventional carbonate oil accumulations identified worldwide.
Operational Problem Definition and Performance Gap
Unconventional well delivery in the UAE entered the industrialization phase with a clear constraint: cycle time and cost per well were not yet competitive for large‑scale development, despite successful appraisal progress. Early wells were drilled under conservative operating approach with not standard procedure across rigs and pads, leading to average well delivery times of 46 days and a high sensitivity to nonproductive time (NPT) events in intermediate and production hole sections.
The objective of the transformation described in this paper was therefore not incremental improvement, but step‑change performance: (1) materially increase section ROP and reduce tortuosity‑driven inefficiencies, (2) compress flat time through repeatable execution practices, and (3) convert learning into a replicable operating model suitable for a high‑volume unconventional drilling campaign.
To enable “apple to apple” performance tracking and decision‑making, each hole section was treated as a separate optimization system (17 ½‑in., 12 ¼‑in., and 8 ½‑in. curve/lateral) and measured progress using consistent operational KPIs including ROP, time‑based efficiency metrics (e.g., W2W times), and well delivery duration. This section-based tracking approach aligns with the broader program objective of making unconventional well delivery safe, repeatable, and cost-competitive at scale.
Positioning Relative to Existing Drilling Optimization Work
The workflow described in this paper aligns with broader drilling optimization approaches reported in recent industry literature, including data‑driven performance tracking, real‑time decision support, and structured learning loops. Unlike studies focused primarily on advanced automation or digital‑twin‑based optimization, this work emphasizes execution discipline, section‑specific learning, and operational standardization as the primary drivers of performance improvement. The approach is complementary to digital methods and is most effective where human-driven learning and iterative field adjustment take priority over automated control.
Geological Framework of the Target Formation
The Target UC Oil Reservoir formation is a Cenomanian-aged organic-rich carbonate unit within the Wasia Group and constitutes the basinal equivalent of the Mishrif platform carbonates (Lazreq et al., 2020; Baniak et al., 2025). Deposition occurred within a relatively deep intrashelf basin under low-energy marine conditions. Stratigraphically, the formation comprises three principal depositional sequences (K120, K130, K140), each characterized by organic-rich intervals interlayered with comparatively cleaner tight carbonate beds (Alharthi et al., 2023; Baniak et al., 2025).
From an operational perspective, the formation is subdivided into Lower and Upper UC Oil Reservoir members. These are further partitioned into sequences (CS1–CS3) and discrete benches (Target Zone 1, 2 & 3), separated locally by tighter carbonate intervals (Rana et al., 2024). The T1 and T2 benches represent the primary development targets within the Lower UC Oil Reservoir, while T3 corresponds to the Upper UC Oil Reservoir interval. This internal stratigraphic framework is fundamental for lateral placement strategy and geosteering precision.
Lithologically, the UC Oil Reservoir is dominated by argillaceous limestone, lime mudstone, wackestone, and fine-grained packstone. It is commonly described as an organic-enriched carbonate mudstone with relatively low clay content (Wenyuan et al., 2019; Ibe et al., 2024). Petrographic analysis and geochemical studies indicate that the organic matter is predominantly marine in origin, largely derived from phytoplanktonic material (Baniak et al., 2025). The formation exhibits pronounced vertical heterogeneity, with small-scale cyclic alterations between organic-rich and cleaner carbonate layers observable even within individual benches (Ibe et al., 2024; Rana et al., 2024).
Gross thickness typically reaches several hundred feet and may locally approach or exceed approximately 600 ft in deeper basinal settings. In UAE, the top of the UC Oil Reservoir is generally encountered at depths ranging between 6,000 and 8,000 ft TVD (Lazreq et al., 2020; Alharthi et al., 2023). Thermal maturity varies structurally, with synclinal areas residing within the oil window and vitrinite reflectance values commonly reported between approximately 0.6 and greater than 1.0 %Ro (Wenyuan et al., 2019; Alharthi et al., 2023).
Regionally UC Oil Reservoir is recognized as a principal source rock for the Mishrif and Simsima reservoirs (Baniak et al., 2025). Total organic carbon (TOC) values typically range from approximately 0.1% to 9%, with localized enrichments reaching up to ~15%. Kerogen is predominantly marine Type II in character (Wenyuan et al., 2019; Baniak et al., 2025).
From a reservoir standpoint, the UC Oil Reservoir represents a tight carbonate system. Matrix porosity is generally below 8%, while permeability falls within the nano- to microdarcy range (Baniak et al., 2025). Hydrocarbon storage occurs within both matrix and intrakerogen pore networks, resulting in negligible natural productivity in the absence of hydraulic stimulation (Ibe et al., 2024). Regional evaluations indicate oil in place on order of hundreds of billions of barrels, with technically recoverable volumes in the tens of billions of barrels, positioning the UC Oil Reservoir among the largest unconventional carbonate oil systems globally (Baniak et al., 2025).
From a drilling and completion perspective, the formation presents significant mechanical variability. Alternations between brittle carbonate intervals and more ductile organic-rich layers produce marked contrasts in drillability, wellbore stability, and fracture propagation behavior (Ibe et al., 2024; Rana et al, 2024). The thin-bedded, heterogeneous architecture necessitates high-accuracy geosteering and has direct implications for stage design, cluster efficiency, and fracture containment control.
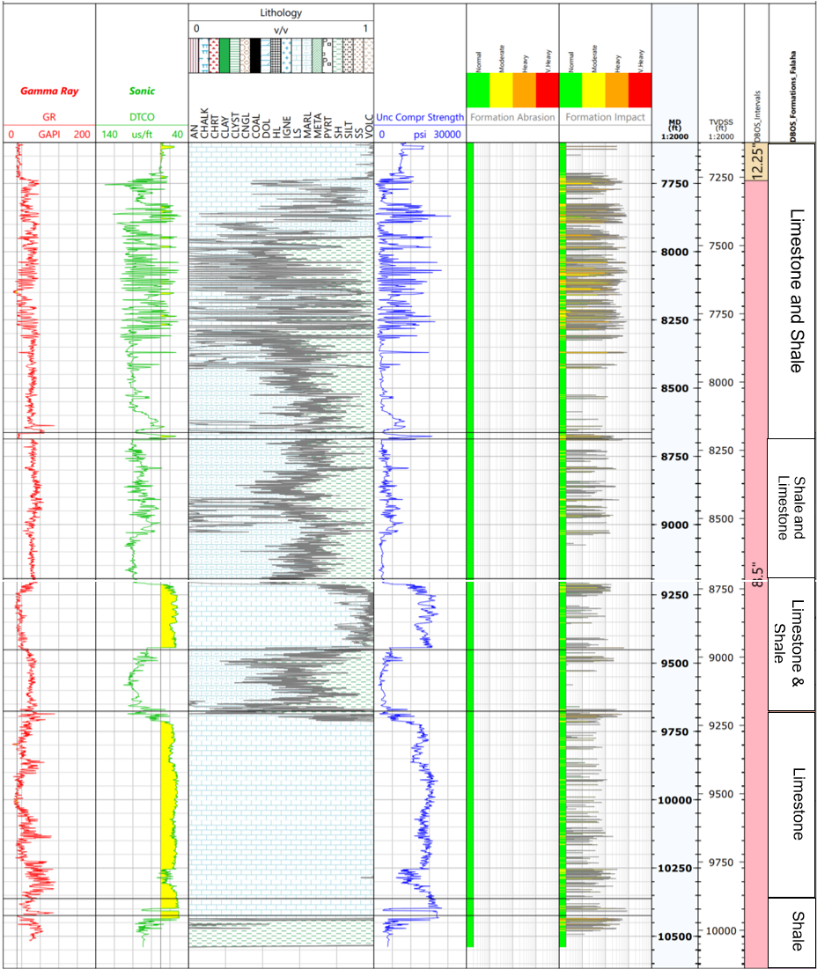
Figure 1– Lithology and unconfined compressive strength. Limestone Caprock to UC Oil Reservoir formations (Example Well).
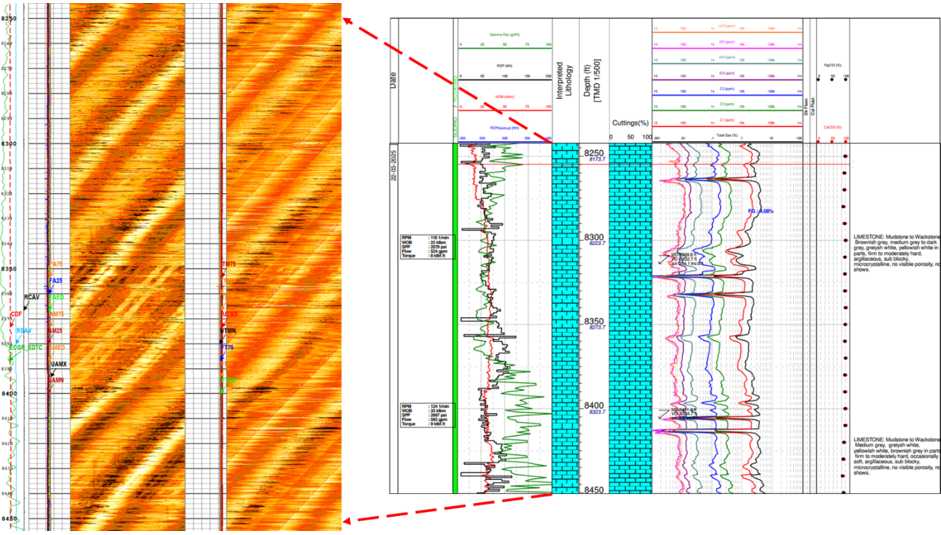
Figure 2 – Typical UC Oil Reservoir limestone image and lithological column.
Baseline performance
The early development phase of the UAE unconventional oil program commenced in 2021 and continued through 2024 prior to full-scale expansion. The primary objective during this stage was reservoir appraisal, operational familiarization, and performance benchmarking across Field #1, Field #2, and Field #3.
More than 140 wells were drilled during this period, including 12 exploratory wells. Pad-based batch drilling was implemented and optimized where surface and intermediate hole sections were drilled first, followed by rig skidding prior to drilling the production interval (Figure 3, Figure 4).
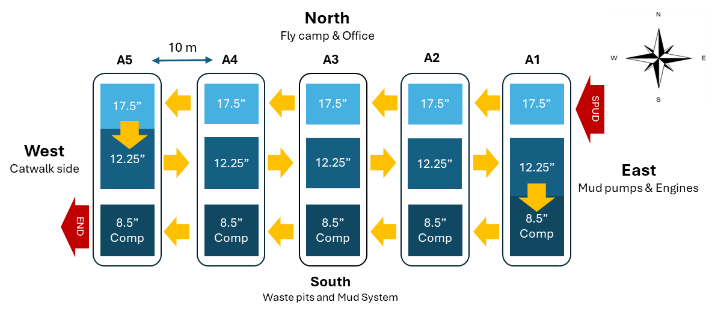
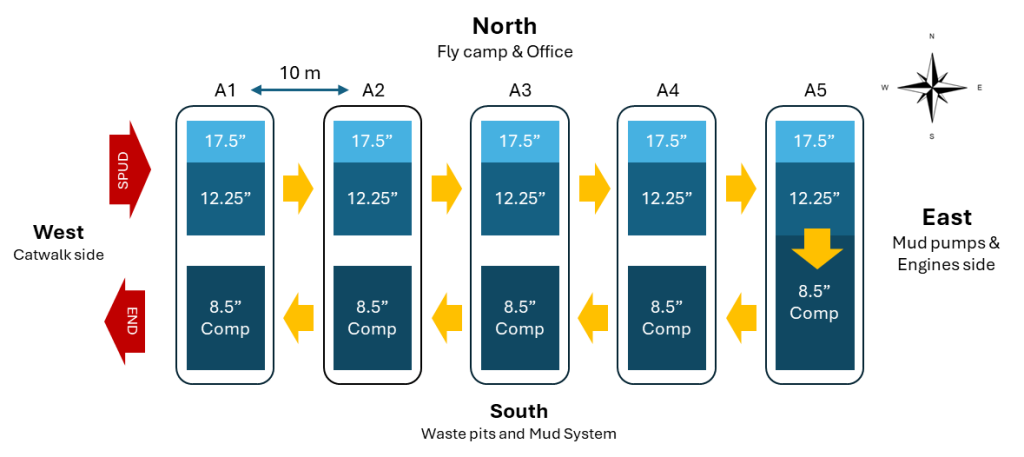
Figure 3 – Original batch drilling schedule. Figure 4 – Optimized batch drilling schedule
The standard well design consisted of four sections, including conductor driving which was done as part of offline preparation during location construction:
- Conductor set at approximately 200 ft.
- 17 ½-in. section drilled vertically to ~1,700 ft.
- 12 ¼-in. section drilled to ~7,500 ft with inclination built to 10–20°.
- 8 ½-in. section drilled from semi-vertical trajectory through curve and horizontal lateral using oil-based mud.
The 17 ½-in. section was mechanically stable, with the primary operational risk being partial or total circulation losses. These were generally manageable and did not drive significant NPT.
The 12 ¼-in. section presented increased geological and operational complexity. The initial casing design set the 9⅝-in. casing shoe at the top of the UC Oil Reservoir formation, leaving Formation #1, Formation #2, Formation #3, and Formation #4 exposed. These intervals exhibited wellbore instability, resulting in tight hole conditions, elevated torque and drag, and operational difficulties during POOH and casing running.
Following several instability events, the casing design was revised. The 9⅝-in. casing shoe was moved to a shallower setting depth into the Limestone Caprock formation (Fig. 5). The upper Limestone Caprock interval contains natural fractures within the first 100 – 200 ft; therefore, the casing was set sufficiently deep within Limestone Caprock (minimum ~500 ft) to avoid placing the shoe across fractured rock and to ensure mechanical stability.
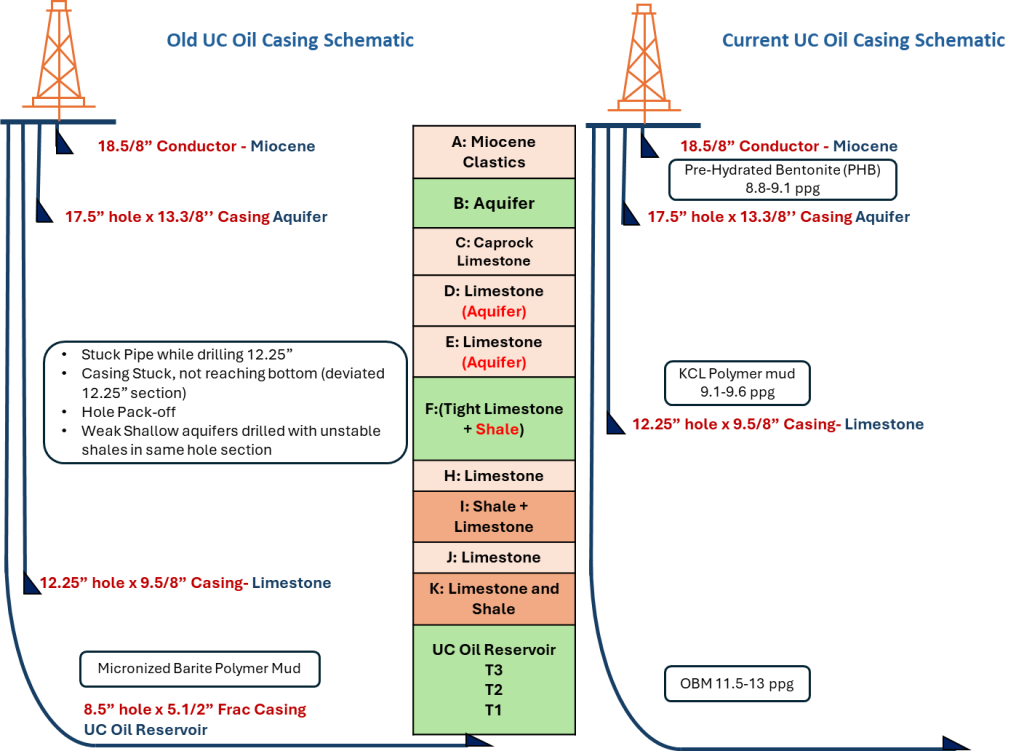
Fig. 5– Well schematic.
The 12 ¼-in. section was also prone to partial and total circulation losses, particularly across the Limestone formation due to localized karst features. These losses were typically resistant to conventional lost circulation material (LCM) treatments and cement plugs. In many cases, circulation was gradually restored during continued drilling as drilled cuttings naturally bridged the loss zones.
An additional operational challenge was the presence of chert within the Aquifer formation. The chert occurred as irregular intrusions rather than continuous layers, making its occurrence difficult to predict during the planning phase. Wells drilled within approximately 120 ft of each other could exhibit significantly different chert exposure. The unpredictable presence of hard, abrasive chert resulted in localized reductions in ROP, increased vibration tendency, and accelerated bit wear.
Chert‑Related Operational Response
When chert was encountered, drilling strategy focused on managing dysfunction and tool preservation rather than forcing continued aggressiveness. Operational responses included adjustments to bit selection, WOB and RPM limits, and the application of vibration‑mitigation measures to stabilize drilling response through chert intervals. Performance analysis confirmed a qualitative correlation between chert intensity, localized ROP degradation, elevated vibration tendency, and accelerated bit wear, reinforcing the need for adaptive rather than fixed operating envelopes in chert‑prone zones.
Under the revised casing design, the 8½-in. section was drilled from the Limestone Caprock formation (~20° inclination) through the curve and landing into the horizontal lateral within the UC Oil Reservoir. The operational objective was to drill the vertical, curve, and lateral in a single run. The stratigraphic sequence included Limestone Caprock (limestone with shale interbeds), Formation #1 (shale), Formation #2 (shale), Formation #3 (limestone), Formation #4 (shale), and UC Oil Reservoir (limestone). The alternating carbonate–shale sequence resulted in variable drilling response and mechanical contrasts.
Performance Metrics and Evaluation Methodology
This paper evaluates drilling performance using section‑based metrics aligned with the campaign objective of delivering repeatable, scalable efficiency gains across pad development. Performance is reported separately for the 17 ½‑in., 12 ¼‑in., and 8 ½‑in. curve/lateral sections to reflect the distinct dominant limiters and improvement levers in each interval.
Primary Key Performance Indicators (KPIs) used in this paper are:
- Average section ROP (ft/hr): tracked by hole section to quantify drilling efficiency improvements associated with redesigned BHAs, updated drilling parameters, improved fluids, and reduction of drilling problems. Section ROP performance is summarized using campaign milestones and averaged results before and after improvement initiatives and below (Fig. 6) indicates original average ROP ands current average ROP figures after implemented updates and improvements.
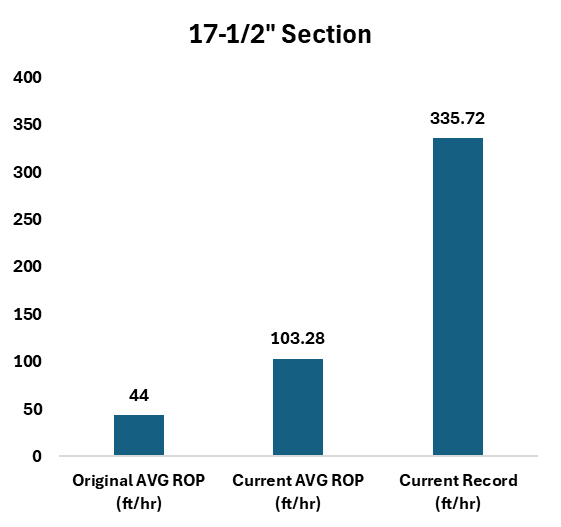
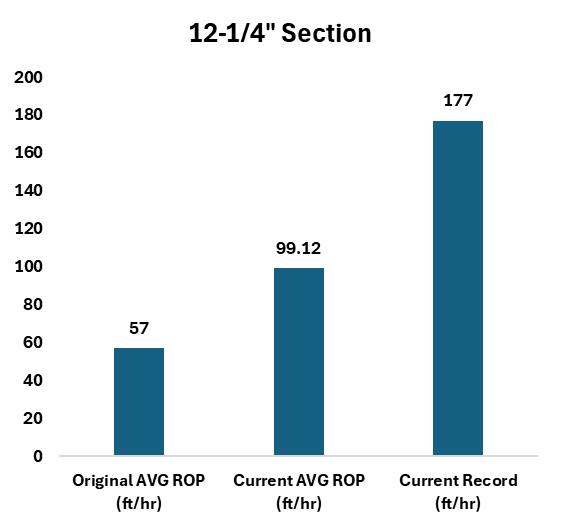
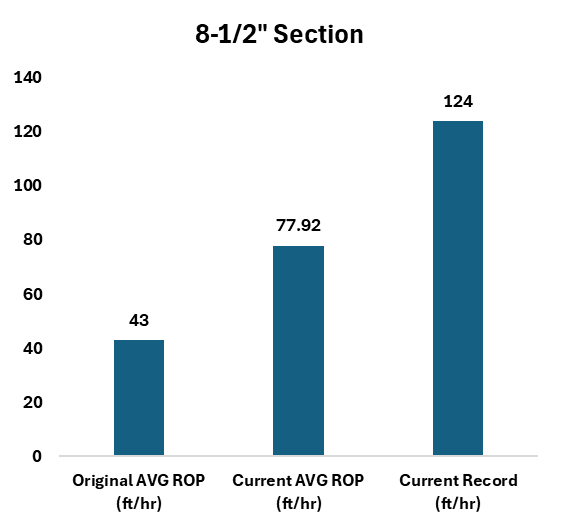
Fig. 6 – Average rate of penetration (ft/hr) at the beginning and after the performance improvement initiatives implemented.
- W2W connection time performance: tracked as a time-based efficiency KPI to quantify reductions in repetitive flat time and execution variability during drilling operations. Improvements are reported as relative reductions consistent with the campaign’s daily performance management approach. (Fig. 7)
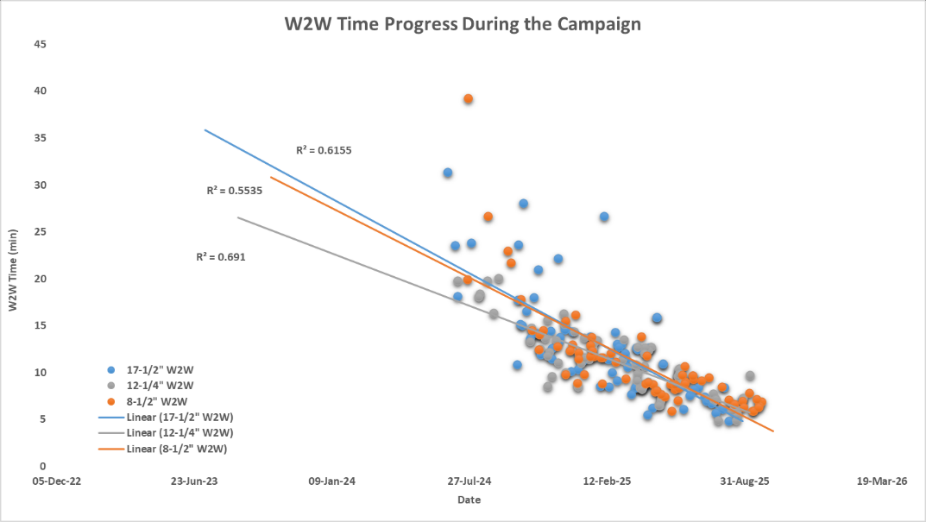
Fig. 7 – Improvement of W2W connection time over a period
- Well delivery duration (days): Reported as spud-to-rig release time, representing the total duration required to drill and complete the well. This KPI captures the integrated impact of drilling performance, operational efficiency, and execution practices on overall cycle time (Fig. 8).
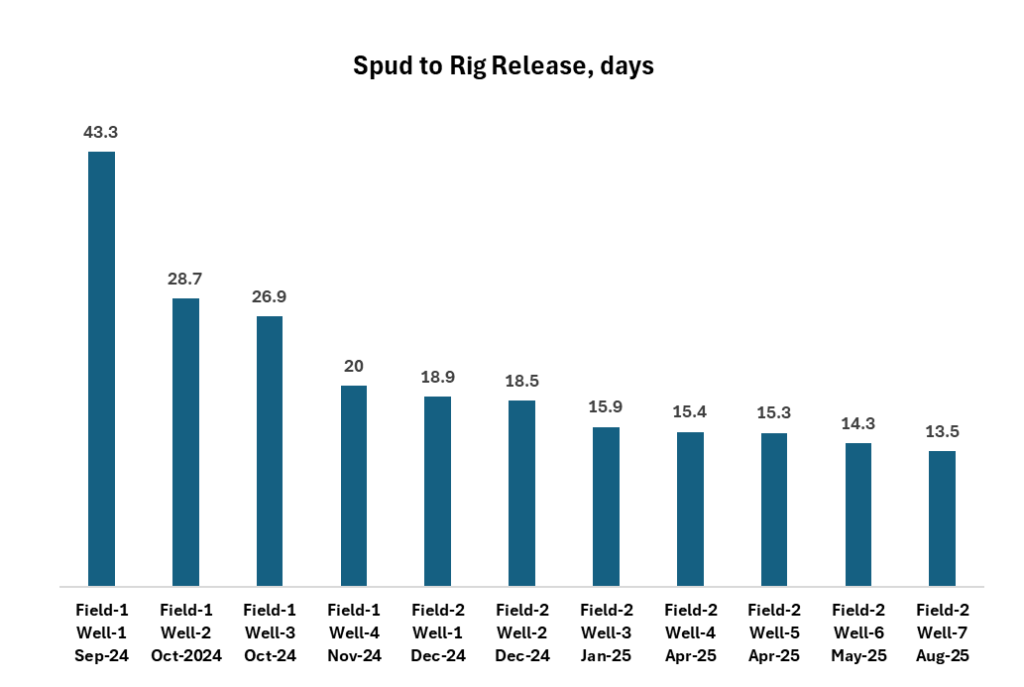
Fig. 8 – Drilling performance milestones. Spud to rig release days. Field #2 and Field #1 oil fields.
KPI Definitions and Measurement Boundaries
Rate of Penetration (ROP): ROP is reported in this paper as section‑average ROP, calculated as total drilled footage divided by total rotary drilling time for the respective hole section. Non‑drilling time (connections, tripping, circulation, backreaming, reaming, and other flat time) is excluded from the ROP calculation. Where referenced separately, instantaneous or on‑bottom ROP values are explicitly identified as such and are not used for headline performance comparison.
Weight‑to‑Weight (W2W) connection time: defined as the combined elapsed time consisting of pre‑connection drilling time (from last stable drilling to set‑down), connection execution time, and post‑connection time required to re‑establish stable weight on bit and resume drilling. This definition captures the full repetitive connection cycle and is used consistently across all wells for time‑based efficiency comparison.
Offline work and flat time: Activities deliberately shifted off the critical rig drilling path (e.g., preparatory work performed offline) are excluded from ROP and W2W metrics. Overall, well delivery duration is reported separately as spud‑to‑rig‑release days, capturing the integrated effect of drilling performance, execution efficiency, and visible rig time.
Technology Implementation During the First Year of UC Oil Development
During the first year of development, the approach was shifted from testing tools on appraisal wells to deploying standardized BHA and parameter package across all active pads. The BHA design and drilling parameters were standardized across all pads and rolled out a unified drilling plan for high-volume operations.
The implementation strategy focused on reducing drilling improvement, enabling higher stable drilling parameters, and improving consistency during well delivery. This included the integration of advanced downhole drilling technologies, redesigned and standard BHAs, fit‑for‑purpose and fit for formation bits, rotary steerable and motor systems, shock and vibration mitigation tools, and improved drilling fluids, supported by controlled execution practices at the rig site.
As illustrated in Fig. 9, technology adoption followed a phased approach, with early emphasis on reliability and stability, followed by parameter optimization once consistent operating envelopes were established. Real-time KPI tracking and consistent execution practices accelerated the learning rate across pads, directly driving the ROP and W2W improvements detailed in the following sections. The fastest well reached 13.5 days spud-to-rig-release within the first year.
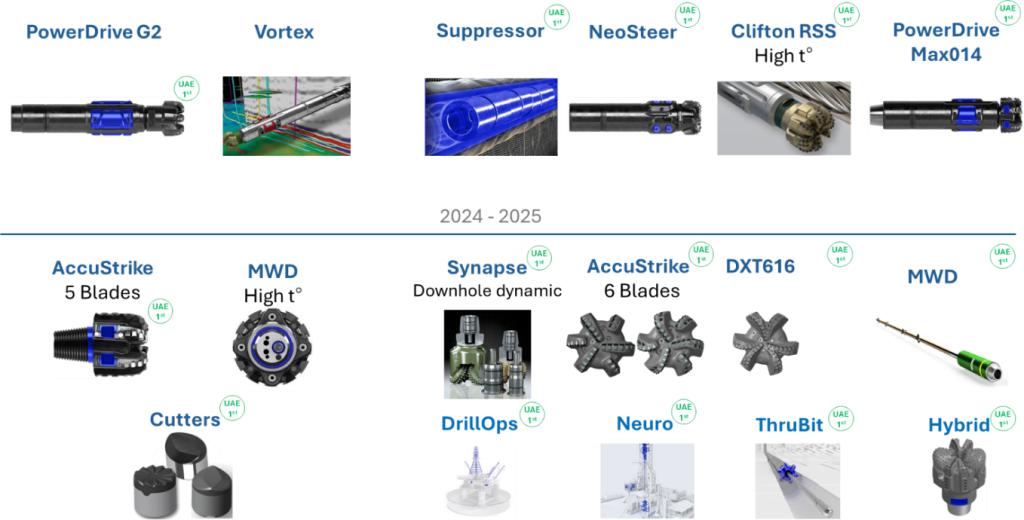
Fig. 9 – Technology implementation during the UC Oil development.
Implementation Across Sections
Implementation was executed through section‑specific workstreams to address the dominant limiters in each interval while keeping interfaces between sections stable (casing setting, mud strategy boundaries, and operational handoffs). The campaign combined innovative drilling practices, advanced downhole tools, RSS/motors, new bit designs, shock reduction tools, and execution strategies.
Across all sections, the implementation approach followed three principles:
- Eliminate potential failures before increasing aggressiveness: reduce vibration and shock, then push WOB/RPM/flow envelopes.
- Standardize what works: convert best runs into a repeatable design and workflow
- Use performance data daily to adjust parameters, tools, and practices quickly at the rig while maintaining a safe operating window.
The campaign scope included more than 1 million feet drilled and over 140 wells completed over the campaign duration, making repeatability and scalability as important as single‑well records.
17½-in. Section Optimization
Baseline 17½‑in. drilling performance was mechanically stable, with the primary operational risk being partial or total circulation losses. While losses were generally manageable and did not dominate nonproductive time, they remained the key uncertainty affecting hydraulic efficiency and the ability to sustain aggressive parameters without compromising operational stability.
Optimization of this section focused on sustaining higher drilling efficiency through repeatable execution and proactive loss-awareness while maintaining stable hole conditions. The campaign standardized BHA and parameter practices suitable for this interval, reinforced daily KPI tracking (including ROP and connection efficiency), and emphasized minimizing invisible lost time by moving preparation activities offline where feasible.
The 17½-in. ROP increased by 202% over the campaign, with pad-to-pad consistency holding as well counts and total footage grew.
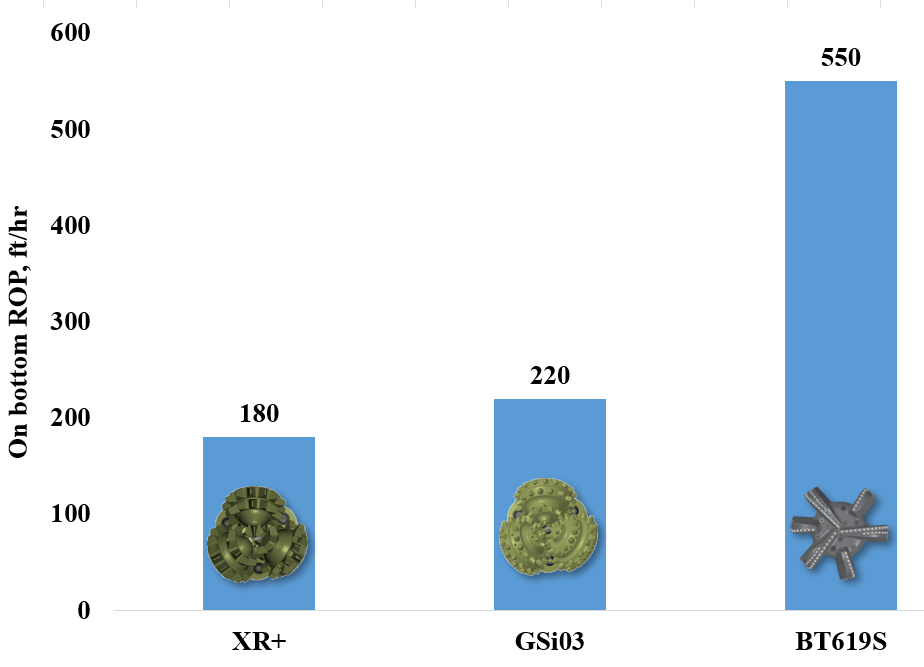
Fig. 10 – 17½-in. section rate of penetration improvement milestones.
12 ¼-in. Section Optimization
The 12¼‑in. section represented the main complexity step-up in the wellbore construction sequence. Early casing design placed the 9⅝‑in. shoe at the top of the UC Oil Reservoir, leaving multiple formations exposed and resulting in wellbore instability expressed as tight hole conditions, elevated torque and drag, and operational challenges during tripping and casing operations. The design was subsequently revised by moving the 9⅝‑in. shoe shallower into the Limestone Caprock formation with sufficient set depth to avoid placing the shoe across naturally fractured rock.
In addition to instability, the interval was prone to partial and total losses across limestone aquifer due to localized karst features, where conventional LCM and cement plugs were often ineffective and circulation was sometimes restored only after continued drilling and natural bridging. A further performance limiter was the presence of unpredictable, abrasive chert intrusions in the Limestone formation, producing localized ROP degradation, increased vibration tendency, and accelerated bit wear. These factors combined to create a section where performance was governed by both geological variability and operational execution discipline.
Optimization actions therefore targeted repeatability under variable conditions: stabilizing operational practices, reducing chance of tools failure and vibration exposure, and enforcing controlled updates to parameters and workflows via the real-time governance model. The 12¼-in. section ROP increased by 153 % and run-to-run variability decreased — both contributing directly to shorter average well durations.
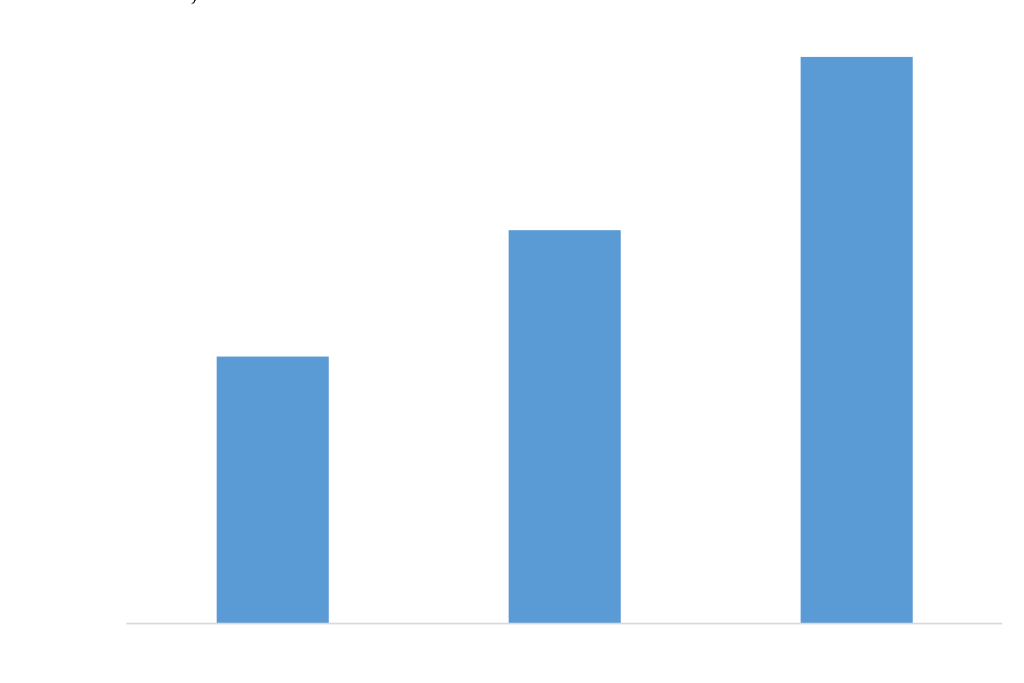
Fig. 11 – 12 ¼-in. section rate of penetration improvement milestones (MS).
8 ½-in. Section Optimization
Under the revised casing strategy, the 8½‑in. interval was drilled from the Limestone & Shale formation through the curve and landed into the UC Oil Reservoir horizontal reservoir section. The operational objective was to drill the vertical, curve, and lateral in a single run, requiring both stable wellbore construction through mixed lithologies and sustained efficiency through the lateral. The stratigraphic sequence included alternating carbonate and shale units before entering the UC Oil Reservoir, producing variable drilling response and mechanical contrasts with direct implications for dysfunction control and wellbore trajectory execution.
The campaign approach integrated engineering, geosteering, tool specialists, and rig teams to accelerate decision cycles and keep execution aligned to the intended operating window. The optimization model emphasized redesigned BHAs, updated drilling parameters, fit-for-purpose tools (including RSS/motor systems and shock reduction capability where applicable), improved fluids, and daily KPI tracking to enable rapid adjustment while maintaining safe execution. The interval performance improvements were achieved while supporting long laterals, including 6,000 ft laterals and the first UAE’s 10,000‑ft lateral unconventional well.
Geosteering and Well Placement Considerations
Given the heterogeneous carbonate nature of the target interval, drilling‑performance acceleration was managed alongside well placement objectives to avoid trading speed for reservoir contact quality. Increased drilling rates were implemented in coordination with geosteering to maintain landing accuracy and steering responsiveness through the curve and lateral. While this paper does not present quantitative placement metrics, operational focus was maintained on preserving in‑zone placement, lateral smoothness, and acceptable tortuosity as drilling aggressiveness increased. Where steering response or formation variability indicated elevated placement risk, drilling parameters were moderated to protect trajectory quality.
The 8½-in. curve/lateral interval achieved a 162% ROP increase. Because this section accounts for the largest share of total footage, the gain was the single biggest driver of cycle-time reduction across the 140+ wells and over one million feet drilled in the campaign.
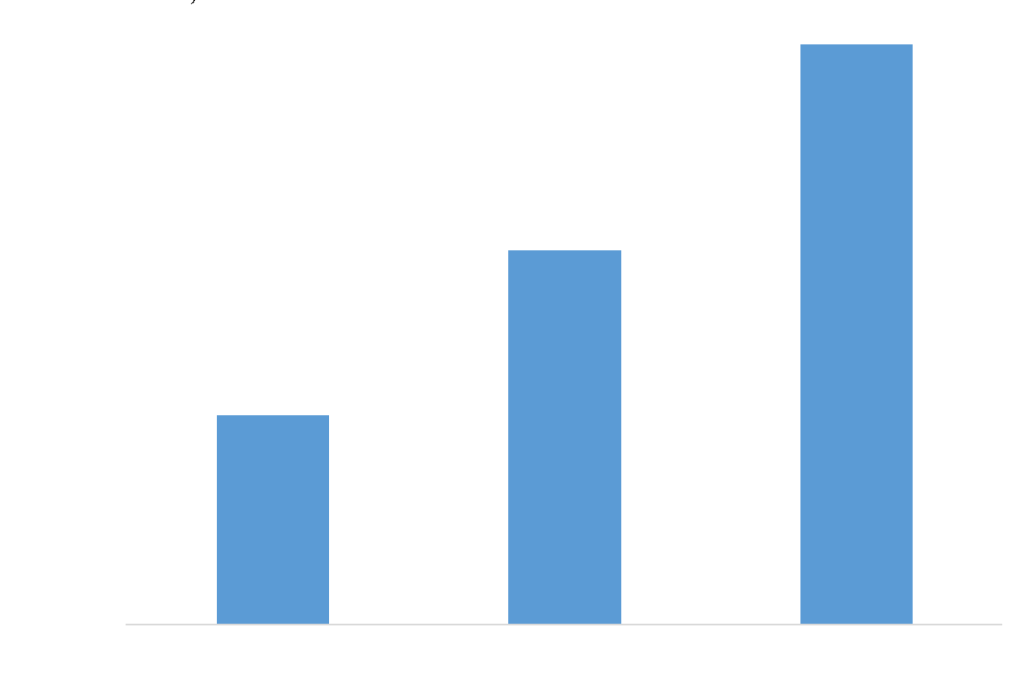
Fig. 12 – 8½-in. section rate of penetration improvement milestones (MS).
Transformation Strategy Framework
The performance transformation was executed as a structured optimization program built around three linked pillars: (1) technical design evolution (BHA/bit/tool selection and drilling dysfunction mitigation), (2) execution discipline (standard work, reduced variability, and fast feedbacks), and (3) data‑driven decision making (consistent KPI tracking with fast feedback to planning and rig site execution).
1) Section‑based optimization rather than whole well trials
Each hole section was treated as a distinct system with different dominant limiters (losses and hydraulics in large hole, stability and losses in intermediate, and dysfunction/geosteering/bit life in production curve and lateral). This enabled targeted solutions and avoided diluting learnings across unrelated failure modes.
2) Test / Learn / Standardize cycle: rapid iteration with controlled risk
Optimization was not implemented as one‑time redesign; instead, new practices and tools were introduced in a controlled manner, evaluated against pre‑defined KPIs (e.g., section ROP and connection time performance), and then standardized into the operating model once repeatability was demonstrated. Standardization was critical to reducing pad‑to‑pad and rig‑to‑rig variability and to converting early wins into sustained performance.
A major contributor to cycle time reduction was minimizing rig time spent on non-value activities by moving preparatory work offline where feasible and enforcing consistent execution of repetitive activities. The program tracked daily performance and used frequent, small parameter and process adjustments to keep the rig in productive drilling mode and minimize downtime
3) Integrated collaboration as an operational mechanism
The program relied on tight integration between drilling engineering, geology/geosteering, tool specialists, and rig teams to accelerate learning and decision cycles. This collaboration was structured around rapid feedback from the rig to engineering and vice versa, enabling faster adoption of improved BHAs, updated parameters, and fit‑for‑purpose tools across the campaign.
The framework was validated by step‑change results across the three key sections: ROP increases of 202% (17 ½‑in.), 153% (12¼‑in.), and 162% (8½‑in. horizontal), along with over 80% reduction in W2W connection times and a reduction in average well duration from 46 days to 13.5 days across the campaign scale.
Sharable Optimization Blueprint Elements
Below are the four main practices from this campaign that are directly applicable to other unconventional programs.
- Section‑based design philosophy: Each hole section is treated as an independent optimization system with its own dominant limiters (losses and hydraulics in large hole, stability and losses in intermediate, and dysfunction, geosteering response, and bit life in the curve and lateral).
- BHA and bit selection logic: Tool and bit choices are governed by formation risk and dysfunction response rather than fixed designs, with escalation toward more aggressive configurations only after stable drilling signatures are established.
- Operating‑window control: Parameter envelopes for WOB, RPM, and flow rate are expanded progressively once vibration and shock signatures are controlled, avoiding step‑change aggressiveness that could compromise reliability or wellbore quality.
- Execution governance loop: A repeatable test–evaluate–standardize workflow is applied using daily KPI tracking (ROP, W2W, section days) to convert successful trials into standard practice and protect gains from performance drift.
Execution Governance and Real‑Time Performance Management
To ensure that performance gains were repeatable rather than case‑specific, the campaign implemented an execution governance model that connected planning, rig‑site decision making, and post‑run learning. Daily operations tracked leading indicators (dysfunction signatures, tool behaviour, connection performance) and lagging indicators (ROP and section days) to detect performance drift early and intervene before losses accumulated into NPT.
Operational changes (parameters, BHA refinements, and workflow adjustments) were managed as controlled updates rather than ad‑hoc rig‑site variations. This approach enabled rapid optimization while maintaining a consistent operating envelope and ensuring that safety and well integrity barriers remained intact during aggressive efficiency improvement. The result was sustained, high‑volume delivery performance across the 17 ½‑in., 12 ¼‑in., and 8 ½‑in. intervals, including long laterals up to 10,000 ft
Environmental and Sustainability Impact
Improvements in drilling efficiency delivered measurable environmental benefits through direct reduction in time on rig and associated fuel consumption per well. Relative to a historical baseline average well duration of approximately 46 days, the optimized campaign achieved substantial cycle‑time compression, including a minimum delivered well duration of 13.5 days, directly reducing diesel consumption associated with rig operations, power generation, and logistics support.
At the well and campaign scale, reduced drilling time translated into lower greenhouse gas emissions proportional to reduced fuel use. Diesel combustion emissions were estimated using the U.S. EPA greenhouse gas equivalency factor of 10.18 kg CO₂ per gallon of diesel consumed. Based on this methodology, the analyzed dataset represents approximately 12.1 million gallons of diesel, corresponding to ~124 thousand metric tons of CO₂ emissions. This magnitude of emissions is equivalent to the annual greenhouse gas emissions of approximately 28,800 gasoline passenger vehicles, using EPA equivalency references.
Normalized performance indicators demonstrate a clear reduction in diesel consumption and CO₂ emissions intensity per well relative to the pre‑optimization baseline, driven primarily by reduced time on rig rather than changes in equipment configuration. While absolute emissions vary by rig type, power configuration, and logistics setup, the time‑based normalization provides a consistent basis for comparing sustainability performance across the campaign.
Higher drilling efficiency also reduced the number of supply runs to each well, the volume of consumables used per well, and total crew-exposure hours on location. These effects compound materially in high‑volume unconventional developments, where incremental efficiency gains per well translate into significant cumulative environmental impact across hundreds of wells.
Shorter well durations cut diesel use and CO₂ emissions per well — a direct sustainability gain that scales with every additional well drilled.
Operational Limitations and Lessons Learned
While the optimization model produced step change performance, the campaign confirmed that unconventional drilling performance remains sensitive to formation variability, interval-specific operational risks, and tool-formation interactions. In the intermediate hole, wellbore instability and circulation losses remained key risks in certain formations and loss zones, requiring operational flexibility and fit-for-purpose mitigation rather than purely parameter-based optimization.
The campaign also reinforced that performance sustainability depends on consistent field practices: improvements achieved through redesigned BHAs, updated parameters, and workflow changes must be standardized and protected from “drift” as rigs rotate and teams change. Continuous learning cycles, consistent KPI tracking, and rapid conversion of best practices into standard work were therefore treated as core technical enablers, not administrative overhead.
Performance–Reliability Trade‑offs
The acceleration of drilling performance described in this paper was implemented within defined reliability and wellbore‑quality constraints. The optimization sequence deliberately prioritized the reduction of drilling dysfunction (shock, stick‑slip, and lateral vibration) before expanding operating envelopes for WOB, RPM, and flow rate.
Operational decision‑making balanced drilling speed against tool reliability and wellbore quality, recognizing that aggressive parameter escalation without stability control can increase bit damage, tool failures, wellbore tortuosity, and downstream casing‑running risk. While these reliability indicators were monitored operationally (e.g., vibration response, tool performance, and operational difficulty during tripping or casing running), this paper focuses on drilling‑efficiency outcomes and does not present a quantitative reliability comparison.
Future work should explicitly couple drilling‑speed KPIs with reliability and wellbore‑quality metrics to fully define the sustainable performance envelope for high‑volume unconventional drilling campaigns.
Conclusions
- Combining technology deployment and execution discipline achieved step‑change drilling performance in UAE unconventional wells. Section average ROP increased by 202% (17 ½‑in.), 153% (12 ¼‑in.), and 162% (8 ½‑in. horizontal) through targeted improvements in drilling practices, downhole tools, and operating strategy.
- Time‑based efficiency improved substantially: W2W connection times decreased by nearly 80%, supporting more consistent operations and contributing to overall cycle‑time compression.
- At campaign scale, the operating model demonstrated repeatability, with more than 1 million feet drilled and over 140 wells completed in one year. Relative to a baseline average well duration of approximately 46 days, the campaign achieved major cycle‑time compression, including a minimum delivered well duration of 13.5 days, representing the fastest unconventional oil well delivered to date in Company.
- The efficiency gains translated into sustainability benefits through reduced diesel consumption and CO₂ emissions per well, primarily enabled by shorter well durations and minimized nonproductive operating time.
- The key technical takeaway is that the step-change ROP gains came from three reinforcing elements: fit-for-section engineering (BHA, bit, and parameter design), daily learning cycles that converted field results into updated practices, and standardized execution that held gains as the campaign scaled. The same approach is directly applicable to other unconventional programs.
Acronyms
ROP – Rate of Penetration
RSS – Rotary Steerable System
W2W – Weight-to-Weight
BHA – Bottomhole Assembly
NPT – Nonproductive Time
LCM – Lost Circulation Material
POOH – Pull Out of Hole
References
- Nabila Lazreq et al. SPE-202760-MS. Tight Oil from Shale Rock in UAE: A Success Story of Unconventional Fracturing. ADIPEC. Abu Dhabi, UAE, 9 – 12 November 2020.
- Greg M. Baniak et al. SPE-229595-MS. Stratigraphic and Sedimentological Characterization of An Unconventional Carbonate Deposit: An Example from the Late Cretaceous UC Oil Reservoir Formation, United Arab Emirates. ADIPEC. UAE, 3 – 6 November 2025.
- E. Ibe et al. SPE-222224-MS. A Journey Unlocking Additional Unconventional Resources: Extensive Integration of Subsurface & Completion. A Case Study from UAE Unconventional Oil Play. ADIPEC. Abu Dhabi, UAE, 4 – 7 November, 2024.
- Rakesh Roshan Rana et al. SPE-222910-MS. Optimizing Exploitation Strategies for UAE Unconventional Oil Resources: A Case Study on Integrating Rock Quality & Completion Quality Aspects. ADIPEC. Abu Dhabi, UAE, 4 – 7 November, 2024.
- COMPANY. COMPANY Deepens Energy Partnerships with US Companies – COMPANY
- Jaxon Caines. New Abu Dhabi JV Announces Unconventional Drilling Benchmark. Journal of Petroleum Technology December 18, 2024.
- Dou, L., Wen, Z., Wang, Z. Distribution of Oil and Gas Resources in Russia. In: Global Oil and Gas Resources: Potential and Distribution. 2024.
- M. Nour, SPE-229587-MS: Beyond Limits: Delivering Over 1,000,000 Feet of Record-setting Unconventional Wells in the UAE, ADIPEC, Abu Dhabi, UAE 3-6 November 2025
- G. Arbadov, SPE-229523-MS: Unlocking Abu Dhabi’s World-Class Unconventional Energy Resources in Safe, Sustainable and Most Economical Way: Journey of Well Duration Reduction For Unconventional Oil Wells by 66%, ADIPEC, Abu Dhabi, UAE 3-6 November 2025