
E. Lagarrigue1, S. Elazab1, S. Elhanbouly1, C. A. Brown2, R. Wargo2, W. R. C. Tiban2 , Z. R. Hamidon2, A. Ryan2, A. Alghamdi2,1. ADNOC, 2. Turnwell
Copyright 2026, Unconventional Resources Technology Conference (URTeC) DOI 10.15530/urtec-2026-4477847
This paper was prepared for presentation at the Unconventional Resources Technology Conference held in Houston, Texas, USA, 22-24 June 2026.
The URTeC Technical Program Committee accepted this presentation on the basis of information contained in an abstract submitted by the author(s). The contents of this paper have not been reviewed by URTeC and URTeC does not warrant the accuracy, reliability, or timeliness of any information herein. All information is the responsibility of and is subject to corrections by the author(s). Any person or entity that relies on any information obtained from this paper does so at their own risk. The information herein does not necessarily reflect any position of URTeC. Any reproduction, distribution, or storage of any part of this paper by anyone other than the author without the written consent of URTeC is prohibited.
Abstract
As unconventional operations expand in the United Arab Emirates (UAE), improving efficiency has increased the number of wells hydraulically fractured each year. Water availability is the key component of the unconventional resource development. In an arid environment such as in UAE, the water cost can be a roadblock for an unconventional resource development. Once wells are on production, managing large volumes of produced and flowback water becomes an additional operational constraint.
To address both challenges, a produced water reuse initiative was deployed for fracturing operations. This case study shows the application of different water treatment and utilization to minimize the water cost in the desert environment.
A multidisciplinary collaboration between ADNOC, Turnwell, and technology partners was established to evaluate, design, and deploy a produced water treatment and reuse system for fracturing operations. The program involved: Produced Water Characterization- Detailed sampling and analysis of flowback and produced water to assess treatability and compatibility with fracturing fluids. Treatment System Design- Selection of modular treatment technologies for solids removal, filtration, and chemical conditioning to achieve reuse-quality water. Operational Integration- Implementation of a closed-loop water management workflow enabling treated water to be directly reintegrated into fracturing operations without disruption to pad efficiency. Monitoring and Verification: Continuous monitoring of fluid quality and system performance to ensure treatment reliability and chemical compatibility.
For the first deployment, a filtration system was deployed to capture the flowback water free of solids and oil content. The timeline to capture the flowback water was specified from pad to pad depending on the treatment parameters to get the cleanest water from the flowback operations.
For water distribution, a set of flexible piping system and booster pumps were deployed to distribute different water sources to fracturing pads. This initiative demonstrated:
• Operational Impact: Seamless integration of treated water into fracturing operations without adverse impact on fluid chemistry or well performance.
• Environmental and HSE Benefits: Reduction in water sourcing and disposal requirements.
• Emission Reduction: Decrease in emissions associated with transportation and logistics.
• Scalability Potential: The system design allows future expansion.
Produced water reuse project in the UAE demonstrates that sustainable water management can be effectively integrated into unconventional fracturing operations without compromising efficiency or performance. The approach provided a practical pathway to reduce freshwater demand, lower environmental footprint, and enhance safety by minimizing trucking exposure.
In a remote desert operation, agile and cost effective water management is a key to develop the unconventional resources. The success of this initiative establishes a regional benchmark for water stewardship in desert. Future work will focus on scaling the system, optimizing treatment costs, and expanding closed-loop water management across the UAE’s unconventional portfolio.
This paper discusses the approach taken to improve the method for reuse of water and optimize completion strategy.
Introduction
Hydraulic fracturing is a critical point in developing unconventional wells for production. During hydraulic fracturing operations, fluid containing proppant or sand is pumped into the reservoir to fracture the rock and then the proppant is in place to ensure the fracture remains open allowing hydrocarbons to flow.
In 2010 the U.S. Environmental Protection Agency did a study on water and hydraulic fracturing activities. The EPA focused on acquisition, use, disposal and reuse in the hydraulic fracturing water cycle (US EPA, 2016). Defined as the following and shown below in Figure 1.
- Water Acquisition – the withdraw of groundwater or surface water to make hydraulic fracturing fluids
- Chemical mixing – the mixing of a base fluid (typically water), proppant and additives at the well site to create hydraulic fracturing fluids
- Well Injection – the injection and movement of hydraulic fracturing fluids through the oil and gas production well and in the targeted rock formation
- Produced water Handling – the onsite collection and handling of water that returns to the surface after hydraulic fracturing and the transportation of that water for disposal or reuse
- Wastewater disposal and reuse – the disposal and reuse of hydraulic fracturing waste water
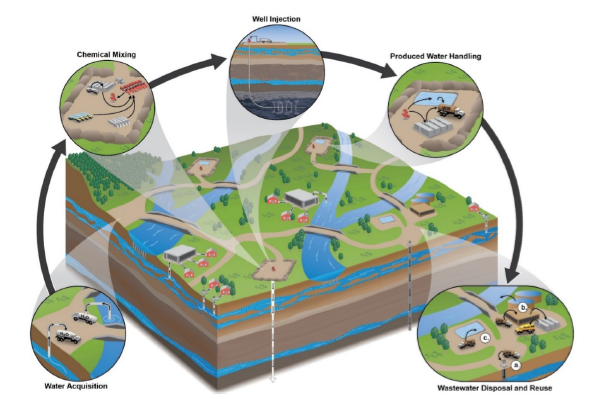
Figure 1: Hydraulic Fracturing Water Cycle (US EPA 2016)
As unconventional operations continue to expand and grow in UAE, each of these components of the hydraulic fracturing water cycle will similarly be part of the field development. This paper will focus on water acquisition, produced water handling and waste water disposal and field application in recent unconventional development in UAE.
Water Acquisition
Water sourcing can come from a variety of sources and vary from different plays even within the same country. Information on two different plays in the US show the difference in these sources. The Marcellus Shale is located in Appalachia where fresh water sources are more focused on surface water instead of ground water. This is different in the Barnett Shale where the fresh water is split between surface and ground. Each of these plays also have a portion of frac water reuse. The reuse in the Marcellus is a higher percentage than in the Barnett. Contributing factors to how much produced water is reused in frac can depend on a variety of factors including but not limited to produced water quality as well proximity and availability of disposal wells. Unconventional completions continues to develop and grow in the UAE. Initially water sources were primarily fresh including ground and municipality water. The transition away from these sources started in 2025 starting to use non fresh solutions (saline water wells) as well as reused produced water.
Table 1: Water Sourcing and Produced Water Handling by play (1US EPA 2016)
| Water Sourcing | Produced Water Handling | ||||||
| Play | SurfaceFreshWater | GroundFreshwater | MunicipalityFresh | Alternative non Freshsolutions | Reused Frac Water | Reuse in Frac | Injection Well |
| Marcellus Shale USA1 | 79% | 7% | 0% | 0% | 14% | 90% | 10% |
| Barnett Shale USA1 | 48% | 48% | 0% | 0% | 4% | 5% | 95% |
| UAE Unconventional 2025 est | 0% | 72% | 20% | 6% | 1% | 4% | 96% |
| UAE Unconventional 2026 est | 0% | 28% | 0% | 71% | 2% | 2% | 98% |
Volume of water required for unconventional wells fracing operations can range – but current average assumptions put the required volume for 4 wells to be completed on a pad at 1.6M bbl (Khan 2025). While this value can vary by location or well design, this would put the water acquisition value at 400,000 bbl per well. In the US, it was found that overall hydraulic fracturing uses a relatively small percentage of water when compared to total water use and availability at large geographic scales. As the UAE grows the unconventional program, focus on ensuring that hydraulic fracturing does not impact the water source by transitioning to non fresh solutions including reused water as an application in frac.
Produced Water Handling
After hydraulic fracturing job is completed, the direction of fluid flow reverses returning fluid to surface to be collected and transferred in a step called flowback. The fluid that initially flows back to surface is mostly hydraulic fracturing fluid and similar in composition to the fluid that was initially pumped during the treatment. As the well continues to flow, the fluid returning to surface is aligned with formation water. Key parameters to monitor include
- Salts – chloride, bromide, sulfate, sodium, magnesium and calcium
- Metals – barium, manganese, iron and strontium
- Naturally occurring organic compounds – benzene, toluene, ethylbenzene, xylenes and oil and grease
The concentrations of these components vary across different regions and reservoirs; the following table summarizes the range of these concentrations comprised in Alkhowaildi 2021 in Table 2.
Table 2:Produced water Composition (Alkhowaildi 2021)
| Parameter | Concentration ranges in flowback water (mg/l) |
| Major Parameters | |
| TDS (Total dissolved solids) | 100–400,000 |
| TSS (Total suspended solids) | 1.2–1000 |
| COD (Chemical oxygen demand) | 1220–2600 |
| TOC (Total organic content) | 0–1500 |
| Total organic acids | 0.001–10000 |
| Chemicals Additives | |
| Glycol | 7.7–2000 |
| Corrosion inhibitor | 0.3–10 |
| Scale inhibitor | 0.2–30 |
| BTEX | |
| Benzene | 0.032–778.51 |
| Toluene | 0.058–5.86 |
| Ethylbenzene | 0.026–399.84 |
| Xylene | 0.01–1.29 |
| Other pollutants | |
| Saturated hydrocarbons | 17–30 |
| Total oil and grease | 2–560 |
| Phenol | 0.001–10,000 |
| Metals | |
| Na | 0–150,000 |
| Sr | 0–6250 |
| Zn | 0.01–35 |
| Li | 0.038–64 |
| Al | 0.4-410 |
| As | 0.002-11 |
| Ba | 0-850 |
| Cr | 0.002-1.1 |
| Fe | 0.1-1100 |
| Mn | 0.004-175 |
| K | 24-4300 |
| Other ions | |
| B | 5-95 |
| Ca2+ | 0-74,000 |
| SO42- | 0-15,000 |
| Mg2+ | 8-6000 |
| HCO3− | 77-3,990 |
| Cl− | 0-270,000 |
Waste Water Disposal
Historically produced water from unconventional hydraulically fraced wells is disposed of into disposal wells. These wells can be limited in pumping rate resulting in restrictions to bring additional wells online. Logistics and economics of using disposal wells depends on how far the well is located form the production wells and the number of wells available. When frac operations occur in proximity to producing wells, this allows another opportunity to reduce the impact of water acquisition. When either source water or disposal capacities are limited, produced water reuse becomes more economically viable and operationally practical (Dawoud , 2024).
The main cost items involved with the two options are the following (Dawoud 2024)
- Total water lifecycle cost w/o reuse ($/bbl) = costs of source water acquisition + sourced water transportation + produced water transportation + produced water disposal
- Total water lifecycle costs reuse ($/bbl) = produced water treatment + produced water storage + produced water transportation
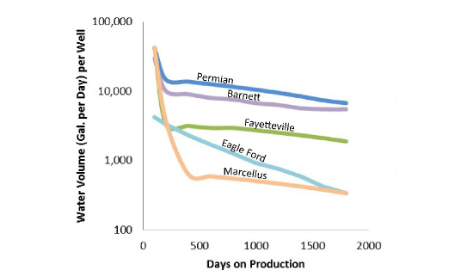
Figure 2: Produced Water Volume in Various Formations (US EPA 2016)
In addition – there is an environmental impact as well when using trucking to move the sourced water as well as the produced water to storage and the emissions associated with the movement. Produced water volumes. In the short term (0-10 days of flowback), various unconventional plays in the US range from an average of 5%-20% of the injected fluid flown back as produced water (US EPA, 2016) and will be the focus for the current application in this paper. As shown below in Figure 2, produced water production continues during the life of the well, beyond the short term impact being reviewed in this paper.
During the short term production, the water properties of the water being flown back are similar to the properties of the water that was initially injected into the well during the hydraulic fracturing operations. When reusing this water as a water acquisition source for frac, minimal treatment is required for the water to be reused in another well for fracturing operations.
In a study by the EPA, 47% of the water flows back and on average for a 4 well pad this equates to 752,000 bbl of water. In this study, it was cited that using an assumption of 103 miles to a centralized treatment or disposal facility, the emission calculation based on internal combustion large trucks resulting in emissions from vehicles transporting water to 1,882 tCO2e (Khan 2025). The assessment includes assessment of the full life cycle of the hydraulic fracturing including manufacturing, transportation, wellsite execution and post fracturing. Transportation of flowback water equates to 15.78% of the total footprint. Instead, through simple treatment and transfer to a nearby frac fleet to consume during frac operations via pipeline instead of trucking emissions associated with this can be avoided.
Field Background and Challenges
Unconventional fracturing operations in the UAE occur in a remote desert locations with challenges for sourcing of water. Surface water sources are not available and objectives to reduce support on ground water sources to have a more sustainable approach to water sourcing for fracturing operations in the development of the program. Various resources are being reviewed and implemented in UAE with successful transition away from fresh water. One of these components, is when produced water is available in proximity to a well that is actively being fraced, to reuse the water rather than trucking to disposal sites. This has benefit not just in the water sustainability aspect for water selection, but in certain cases as well with cost optimization and emissions improvement.
Operations in remote desert locations face many challenges for logistics. Travel through sand dunes and on sand roads results in limited resources capable of completing movements increasing risk of operational delay.
Engineering Workflow Development
During the operations, key components including produced water characterization, treatment system design and operations integration were reviewed. Each of these were broken down as follows:
Produced Water Characterization- Detailed sampling and analysis of flowback and produced water to assess treatability and compatibility with fracturing fluids.
Treatment System Design- Selection of modular treatment technologies for solids removal, filtration, and chemical conditioning to achieve reuse-quality water.
Operational Integration- Implementation of a closed-loop water management workflow enabling treated water to be directly reintegrated into fracturing operations without disruption to pad efficiency.
Produced Water Characterization
During the fracturing operation water samples were obtained from both fresh water sampling as well as reuse water sampling for a detailed chemical analysis to be performed in the lab to compare the source fracturing water against the flowback water.
Table 3: Water Source Composition
| Test Parameter | Unit | Sample Source fracturing water (1) | Sample Source fracturing water (2) | Sample Source fracturing water (3) | Sample Source fracturing water (4) | Sample Source fracturing water (5) | Reuse Water Sample (1) | Reuse Water Sample (2) | Reuse Water Sample (3) | Reuse Water Sample (4) | Reuse Water Sample (5) |
| Turbidity | NTU | 8.04 | >500 | 6.79 | 18.3 | ||||||
| pH | 6.70 | 6.60 | 6.70 | 6.60 | 7.54 | 7.60 | 7.05 | 7.51 | 7.34 | ||
| Electrical Conductivity | uS/Cm | 13280 | 18050 | 13430 | 13490 | ||||||
| Total Suspended Solids (TSS) | mg/L | 14 | 70 | 9 | 25 | ||||||
| Chloride (Cl) | mg/L | 90752 | 1900 | 2500 | 2400 | 1900 | 8460 | 5672 | 7500 | 3758 | 3616 |
| Sulphate (SO4) | mg/L | 417 | 3545 | 1910 | 1296 | 1397 | |||||
| Bicarbonate (HCO3) | mg/L | 219 | 1519 | 509 | 278 | 276 | |||||
| Calcium (Ca) | mg/L | 10821 | 281 | 651 | 641 | 621 | |||||
| Magnesium (Mg) | mg/L | 1774 | 581 | 74 | 73 | 48.6 | |||||
| Total Hardness as (CaCO3) | mg/L | 1200 | 1390 | 1250 | 1230 | 36.4 | 1940 | 3075 | 1900 | 1750 | |
| Total Alkalinity | mg/L | 1600 | 418 | 228 | 226 | ||||||
| Chlorine, Free (Cl2) | mg/L | 230 | <0.02 | <0.02 | <0.02 | ||||||
| Sodium (Na) | mg/L | <0.02 | 3189 | 2412 | 2457 | ||||||
| Potassium (K) | mg/L | 1416 | 2188 | 76 | 68 | 67 | |||||
| Iron (Fe) | mg/L | 0 | 1 | 0 | 0 | 0 | 62 | 8.2 | 15 | 1.29 | 1.72 |
| Copper (Cu) | mg/L | 1.11 | 0.12 | <0.01 | <0.01 | ||||||
| Chromium (Cr) | mg/L | <0.01 | 0.07 | 0.18 | 0.18 | ||||||
| Cadmium (Cd) | mg/L | 0.17 | <0.001 | <0.001 | <0.001 | ||||||
| Manganese (Mn) | mg/L | 0.07 | 0.25 | 0.18 | 0.08 | ||||||
| Lead (Pb) | mg/L | 0.13 | <0.01 | 0.03 | 0.03 | ||||||
| Zinc (Zn) | mg/L | 1.27 | 0.06 | <0.01 | <0.01 | ||||||
| Hydrogen Sulphide | mg/L | 0.01 | 1.2 | 0.02 | 0.05 |
In addition to understanding chemical composition, the fluid samples were tested to ensure chemical compatibility and hydration time for the frac fluid chemical formula
Table 4: Produced Water Hydration (change table so it compares original water source vs produced water source)
| Water Source | HVFR Conc (gpt) | Shear Rate (Sec-1) | Hydration Time (minutes) | ||||||||||||
| 0 | 1 | 2 | 4 | 6 | 10 | 15 | |||||||||
| Source Sample fracturing water (2) | 1 | 170 | 4 | 4 | 4 | 4 | 4 | 4 | 4 | ||||||
| 2 | 4 | 5 | 5 | 5 | 5 | 5 | 5 | ||||||||
| 3 | 6 | 6 | 6 | 6 | 6 | 6 | 6 | ||||||||
| 1 | 511 | 3 | 3 | 3 | 3 | 3 | 3 | 3 | |||||||
| 2 | 3 | 4 | 4 | 4 | 4 | 4 | 4 | ||||||||
| 3 | 4 | 5 | 5 | 5 | 5 | 5 | 5 | ||||||||
| Source Sample fracturing water (3) | 1 | 170 | 4 | 4 | 4 | 4 | 4 | 4 | 4 | ||||||
| 2 | 4 | 4 | 4 | 5 | 5 | 5 | 5 | ||||||||
| 3 | 5 | 5 | 5 | 5 | 6 | 6 | 6 | ||||||||
| 1 | 511 | 3 | 3 | 3 | 3 | 3 | 3 | 3 | |||||||
| 2 | 3 | 3 | 3 | 3 | 3 | 3 | 3 | ||||||||
| 3 | 4 | 4 | 4 | 4 | 4 | 5 | 5 | ||||||||
| Source Sample fracturing water (4) | 1 | 170 | 4 | 4 | 4 | 4 | 4 | 4 | 4 | ||||||
| 2 | 5 | 5 | 5 | 5 | 5 | 5 | 5 | ||||||||
| 3 | 5 | 5 | 5 | 5 | 6 | 6 | 6 | ||||||||
| 1 | 511 | 3 | 3 | 3 | 3 | 3 | 3 | 3 | |||||||
| 2 | 3 | 3 | 3 | 3 | 3 | 3 | 3 | ||||||||
| 3 | 4 | 4 | 4 | 4 | 4 | 5 | 5 | ||||||||
| Source Sample fracturing water (5) | 1 | 170 | 4 | 4 | 4 | 4 | 4 | 4 | 4 | ||||||
| 2 | 5 | 5 | 5 | 5 | 5 | 5 | 5 | ||||||||
| 3 | 5 | 5 | 5 | 5 | 5 | 6 | 6 | ||||||||
| 1 | 511 | 3 | 3 | 3 | 3 | 4 | 4 | 4 | |||||||
| 2 | 3 | 3 | 3 | 3 | 3 | 3 | 3 | ||||||||
| 3 | 4 | 5 | 5 | 5 | 5 | 5 | 5 | ||||||||
| Reuse water sample (3) | 1 | 170 | 4 | 4 | 4 | 5 | 5 | 5 | 5 | ||||||
| 2 | 5 | 6 | 7 | 7 | 7 | 8 | 8 | ||||||||
| 3 | 7 | 8 | 10 | 11 | 12 | 13 | 13 | ||||||||
| 1 | 511 | 3 | 4 | 4 | 4 | 4 | 4 | 4 | |||||||
| 2 | 4 | 5 | 6 | 6 | 6 | 7 | 7 | ||||||||
| 3 | 6 | 7 | 9 | 10 | 12 | 12 | 12 | ||||||||
| Reuse water sample (4) | 1 | 170 | 4 | 5 | 5 | 5 | 5 | 5 | 5 | ||||||
| 2 | 6 | 7 | 7 | 8 | 8 | 9 | 10 | ||||||||
| 3 | 8 | 9 | 10 | 12 | 13 | 17 | 18 | ||||||||
| 1 | 511 | 3 | 3 | 4 | 4 | 5 | 5 | 5 | |||||||
| 2 | 5 | 5 | 6 | 6 | 7 | 8 | 9 | ||||||||
| 3 | 6 | 7 | 8 | 10 | 13 | 16 | 17 | ||||||||
Treatment System Design
Plan for field trial was to utilize the flowback water in real time for fracturing operations. As such a filtration unit was selected that was capable of handling mixture of water and oil contaminated fluids, moderate to high TSS, monitor of H2S in water and handle of possible presence of hydrocarbons and iron sulphides. Initial filtration was completed for produced water to be pumped during hydraulic fracturing operations. For the initial selection of the filtration unit a technical review and high pressure filter cartridges with a medium comprised of a resin impregnated cellulose medium. The cartridge selection was specifically selected based on the wide range compatibility of fluids as well as maximum temperature range. Coalescer to remove liquid contaminants was also selected. The location layout schematic can be seen below in Figure 3. Following the fracturing operations, additional testing was completed to review options using water clarifier and additional chemicals to further treat the water to levels capable of being used for irrigation.
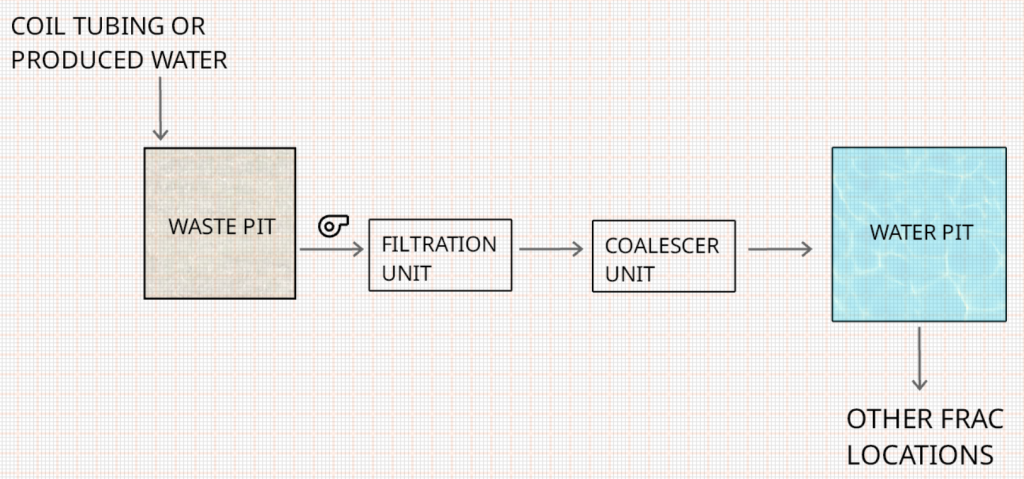
Figure 3: Location Layout Schematic
Operational Integration of the Treatment System
The treatment system was operationally integrated into hydraulic fracturing activities through a staged, coordinated workflow as per Figure 4 designed to enable continuous, real-time processing of flowback and produced water.
The integration strategy prioritized operational reliability, consistency of treated water quality, and minimal disruption to stimulation activities.
The system was deployed and commissioned in parallel with fracturing operations, allowing flowback water to be treated and reused with no interruption to pumping schedules.
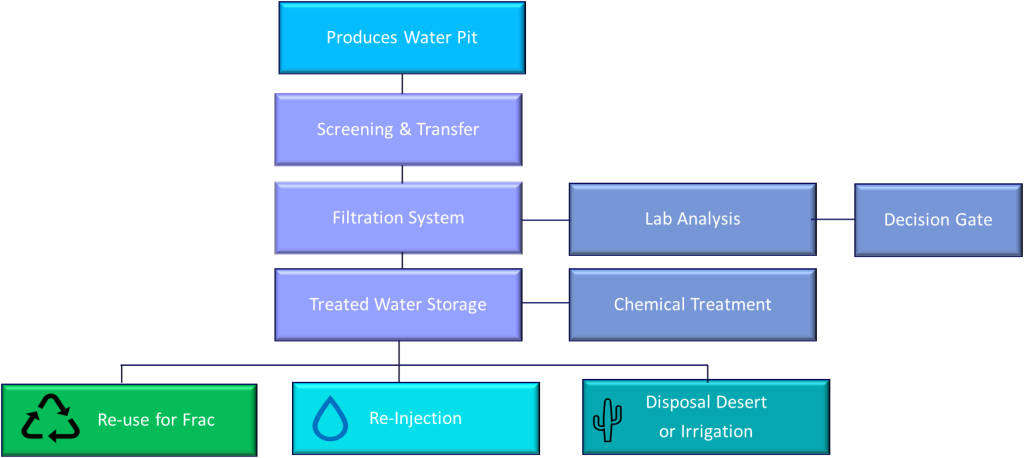
Figure 4: Produced Water Workflow
System Placement and Flow Configuration
The treatment system was physically integrated into the fracturing layout to minimize fluid handling complexity and ensure compatibility with stimulation operations.
Flowback and produced water were initially routed to a dedicated produced water pit or tank system, providing surge capacity and buffering against variable flowback rates. From the source, water was transferred through a screening and transfer module, where coarse solids and debris were removed to protect downstream equipment and stabilize inlet conditions to the filtration system.
Primary treatment was achieved through an inline filtration system positioned between screening and treated water storage. The filtration system was selected to handle:
- Oil-contaminated fluids
- Moderate to high total suspended solids (TSS)
- Iron sulfides and fine particulate matter
- Variable fluid composition typical of post-frac flowback
Filtered water was directed to treated water storage, which provided hydraulic buffering and residence time for verification prior to reuse. From treated storage, water could be selectively routed based on quality and operational requirements to:
- Fracturing operations for direct reuse
- Injection facilities
- Disposal or irrigation following additional treatment
The modular flow configuration allowed selective diversion and operational flexibility while maintaining continuous frac support.
Monitoring and Real-Time Control
To ensure treatment performance and protect fracturing operations, the system incorporated continuous real-time monitoring and automated control.
Instrumentation was installed at critical points in the process (inlet, post-filtration, and treated storage) to monitor:
- Flow rate and system pressure
- Differential pressure across filtration units
- Turbidity and suspended solids indicators
- pH and electrical conductivity
- Dissolved hydrogen sulfide (H₂S)
This control strategy ensured stable, uninterrupted treatment during dynamic flowback conditions.
Quality Assurance and Fracturing Fluid Compatibility
Water quality assurance was achieved through a combination of real-time monitoring, routine field sampling, and laboratory verification.
Grab samples were collected at the filtration outlet and treated water storage and analyzed for:
- Total suspended solids (TSS)
- Oil and grease
- Total and dissolved iron
- pH and conductivity
Laboratory analysis results were used as a formal decision gate to confirm suitability of treated water for reuse in fracturing operations. Only water meeting predefined reuse criteria was approved for direct addition to frac fluids.
Where required, chemical treatment was applied downstream of filtration to address residual iron, sulfides, H₂S, or compatibility risks. Chemical programs were selected to ensure compatibility with fracturing fluid additives, surface equipment.
This quality assurance framework ensured treated water did not negatively impact stimulation performance, equipment integrity, or reservoir productivity.
Field Implementation & Results
Produced water was successfully implemented with initial test of pumping over 80,000 bbls on a pad. This was mixed with ground water sourced water during the frac. When comparing the stages over the course of the pad, there was no distinguishable difference in pressure between stages pumped with produced water vs those with ground water. Similar rates, pressures and friction reducer concentrations were observed across the stages.
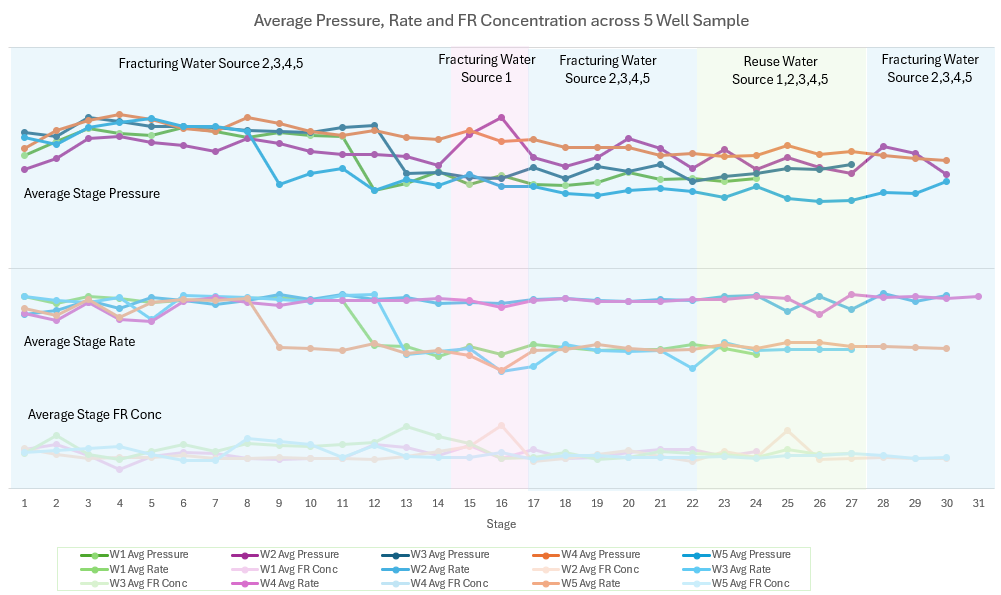
Figure 5: Average Pressure, Rate and Friction Reducer (FR) Concentration across 5 well sample
Key Discussion Points
In summary, the following key learnings and discussion points were derived from the execution of utilizing produced water in UAE unconventionals
- Water composition: in initial days of flowback, less than 30 days, the water composition flown back is similar to the composition that was pumped during hydraulic fracturing operations. Ongoing understanding to be reviewed with extended flowback time
- Filtration selection: minimal filtration required to be able to pump flowback water from early flowback in hydraulic fracturing operations
- Economics: Economics will continue to play a role in when flowback water is used for hydraulic fracturing operations vs when it is transported to disposal well
- Emissions: When able to use the produced water in a nearby hydraulic fracturing operations, the emissions for the overall project are reduced through the removal of trucking and instead transferred via flex pipeline.
Collectively, these learnings demonstrate that successful implementation of produced water for unconventional hydraulic fracturing operations in UAE. When reviewed on a project level, utilization of flowback water can offer an economical and sustainable option for alternative water sourcing in the desert operations for unconventional completions in UAE.
Conclusions & Way Forward
Future development will focus on continuing to evaluate water composition parameters as flowback timeline progress longer in time. In addition, continued economic analysis to be evaluated for field optimization of utilizing produced water for hydraulic fracturing vs other solutions taking into account sustainability implication.
Acknowledgements
The authors would like to thank ADNOC and Turnwell for support throughout the campaign and for granting permission to publish this work. The authors also extend their gratitude to all team members for the safe and efficient job execution.
References
US EPA. 2016. Hydraulic Fracturing for Oil and Gas: Impacts from the Hydraulic Fracturing Water Cycle on Drinking Water Resources in the UnitedState. https://cfpub.epa.gov/ncea/hfstudy/recordisplay.cfm?deid=332990.
Khan, Abdul Muqtadir, Anderson, Christine, Prabhu, Rasika, Beletskaya, Anna, Kuan, Pearl, Danican, Samuel, and Farshid Mostowfi. “A Comprehensive Life Cycle Assessment of Hydraulic Fracturing.” SPE J. 30 (2025): 2190–2202. doi: https://eureka.slb.com:2083/10.2118/220480-PA
Loomba, A. K., Aaboen, G. S., Soni, P. K., and M. E. W. Stanko. “Transforming Produced Water Management with a Decision Support System.” Paper presented at the Offshore Technology Conference, Houston, Texas, USA, May 2025. doi: https://eureka.slb.com:2083/10.4043/35993-MS
Bonapace, J., Giglio, M., Moggia, J., and A. Krenz. “Water Conservation: Reducing Freshwater Consumption by Using Produced Water for Base Fluid in Hydraulic Fracturing–Case Histories in Argentina.” Paper presented at the SPE Latin America and Caribbean Petroleum Engineering Conference, Mexico City, Mexico, April 2012. doi: https://eureka.slb.com:2083/10.2118/151819-MS
Alkhowaildi, M., Ruwayshid, S., Sahu, Q., and A. Al Ali. “Towards Water Sustainability: A Success Story of Waste Water Reuse for Fracturing Operations.” Paper presented at the ADIPEC, Abu Dhabi, UAE, October 2023. doi: https://eureka.slb.com:2083/10.2118/216254-MS
Alkhowaildi, Mustafa Ahmed, Mahmoud, Mohamed, Bataweel, Mohammed Abdullah, and Bassam Tawabini. “A Comprehensive Review on the Characteristics, Challenges and Reuse Opportunities Associated with Produced Water in Fracturing Operations.” Paper presented at the Abu Dhabi International Petroleum Exhibition & Conference, Abu Dhabi, UAE, November 2021. doi: https://eureka.slb.com:2083/10.2118/207835-MS
Dawoud, Mohamed A., Sefelnasr, Ahmed, Ebraheem, Abdel Azim, Alnaimat, Fadi, Mathew, Bobby, Hamouda, Mohamed A., Hassan, Ashraf Aly, Zubari, Waleed Khalil, and Mohsen Sherif. “Produced Water Treatment and Reuse Options: Alternatives for Sustainable Water Resources.” Paper presented at the SPE Water Lifecycle Management Conference and Exhibition, Abu Dhabi, UAE, March 2024. doi: https://eureka.slb.com:2083/10.2118/218959-MS
Ayirala, Subhash, Alowaid, Abdulrahman, Saleh, Salah, and Karim Mechkak. “Successful Execution of World’s First ZLD Pilot with Extreme Salinity Unconventional Frac Flowback Produced Water.” Paper presented at the Middle East Oil, Gas and Geosciences Show (MEOS GEO), Manama, Bahrain, September 2025. doi: https://eureka.slb.com:2083/10.2118/227208-MS